Portfolio
I’m an experienced, award-winning news artist and data journalist whose work is fueled by trying to find the answer to a simple question: How do I best tell a story?
I enjoy working closely with reporters and editors to find, understand and communicate what we learn from data. To that end, I've amassed a suite of tools, including:
- Data: R and the Tidyverse, Python/Pandas, SQL and Postgressq.
- Excel and Google sheets for examining data.
- Esri and Qgis for mapping.
- Adobe suite: Illustrator, Photoshop and inDesign for creating static charts, images and layouts for print
- Web apps and charts: The Python microsite builder Flask. A customized build of the NPR graphics rig that uses highcharts.js for interactive charts. Experience with HTML, CSS and the Twitter Bootstrap framework for web design. Leaflet.js for online interactive mapping
I’ve been fortunate to benefit from the abundance of low cost or free classes on the web and the generosity of professional colleagues who share their knowledge. And so I pay that forward by helping others learn these tools, like with this tutorial for reporters on using R to create publication-ready charts and maps. If you're interested in data journalism. here's a list of tools to start with.
You can see my latest resume here.
Below are links to samples of some of my work. All links open in new windows.
Online
Since starting at Modern Healthcare in late 2018, I've done a deep dive into publicly-available data focusing on hospitals, healthcare systems, and skilled-nursing homes, examining complex financial, quality and owneship data.
That work fueled a major redesign of our data center, now called Data & Insights. This feature brings the data into five dashboards that premium subscribers can use to explore information for more than 6,000 hospitals and almost 15,000 nursing homes. We also track, with our own research and through partnerships, healthcare-specific employment numbers, physician and executive compensation and mergers & acquisition activity.
My role in this goes beyond simple* data analysis. I brought key insights into the conversation and vastly expanded on the very generalized topics in the original plan. I showed how, using code to scrape and analyze data, we could present a great amount of content with far deeper information and insights than continuing the labor-intensive data mining on topics that had limited interest for our subscribers.
Tasked with using a third-party service to store data for publication, I designed and populated relational databases with key information. As the third-party service was not up to the task of presentation, I utilized my HTML, CSS and Javascript skills to create custom widgets allowing readers to drill down into the data for the individual hospitals or nursing homes.
Since the reinvigorated Data & Insights debuted in 2023, we've not only halted a decline in premium subscriptions but - as of mid-2024 - increased them by more than 40%.
As Data & Insights is available only to premium subscribers, please contact me at aabroder (at) gmail.com. I would be happy to schedule a zoom meeting and demonstrate the site.
* To be clear, there is nothing "simple" about cost reports and ownership data for hospitals and nursing homes. If you have several days to spare, I'd be happy to discuss all the ways the government could improve on what they collect.
Here are other interactive charts and maps for news features and deadline stories. These visualizations are designed to be responsive, adjusting to the size of a browser window.
- A state-by-state look at Medicaid redeterminations.
- Interactive map of sterilizers where the EPA has identified elevated risks.
- I've used hospital data to create metropolitan profiles for use in special reports.
- I've done a few deep dives into tax forms for not-for-profits, including
- An investigation into the community benefit NFP hospitals are required to report revealed a flaw in the form that would cause some hospitals to report incorrect numbers. I used Python and a specialize library to mine data in bulk from form 990s.
- We also looked at CEO pay for not-for-profits.
- Here's a comprehensive list of Modern Healthcare interactives through 2023. I update this list at the end of each year as they graphics run with stories exclusive to our subscribers.
Many of the interactives at my former job are now gone from the internet. A few remain here. Some highlights:
- Annual Illinois School Report Cards: (no longer online) After the Great Recession, I found myself in the position of being the person at the Daily Herald with the most knowledge of the annual data release from the state. I decided to use the data to challenge myself and embarked on a years-long effort to learn and develop the skills necessary to comprehensively present the data.
I’ve assisted reporters from the Peoria Journal-Star and the Chicago Sun-Times in their coverage, and made appearances on ABC 7 and Chicago Tonight to discuss this work. - Poverty-Acheivement Index: (Archived at github) I wanted to give our readers a deeper understanding of the numbers they were seeing in the annual school report card. The result was our Lisagor award-winning look at the effect of poverty on school performance. This important series came out during a critical time in the debate about school funding in Illinois.
- Perilous passages: An examination of pedestrian and cyclist crashes in the suburbs. In addition to the online presentation, I often created the print package as well.
- 2018 primary election results: (no longer online) With contested races for governor for both parties, I broke out county-by-county stats and compared turnout for both parties.
- The 2016 primary and election: (no longer online) For the first time in years Illinois had contested presidential primaries for both parties (often the contests had been decided before they got to Illinois). I took advantage of that to examine precinct-by-precinct how the suburbs changed in their voting preferences. Little did I know how controversial the election would be.
I started with the primary, looking at the Democratic and Republican votes, then compared the turnouts between the two party primaries to get an idea of interest.
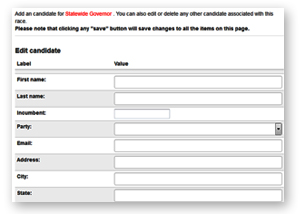
After the general election, I compared how Clinton and Trump did while also seeing how each precinct voted in the primary. The result was interesting, with quite a bit of crossover voting from one party to another - sometimes in unexpected areas. - Candidate questionnaires:
I managed the process of contacting and questioning hundreds of politicians for primary and general elections, keeping track of the more than 1,500 races in the Daily Herald circulation area.
Print graphics
From the Daily Herald.
- Decline of prep football: The Daily Herald teamed up with the Chicago Sun-Times to examine participation in high school football. But rather than simply charting the raw numbers, I put them in context with changes in school enrollment and key events in the concussion saga. I also created an online presentation for all the numbers that is no longer online.
- Population decline in the suburbs: While Illinois was losing population, the prevailing thought was that people were mainly leaving downstate counties. I checked that out in the summer of 2017 and found widespread decline in the city and suburbs from 2014 to 2016.
- Cook County soda tax: Fun treatment for reporter Jake Griffin's story on all the taxes hanging on a 32-ounce drink.
- Peak tornado months: A look at the history of tornados in the suburbs.
- The gender gap in high school scores: My examination of male and female students' high school test scores won the Lisagor in 2012.
- Path to Foreclosure: A major part of the Daily Herald's Lisagor award-winning coverage of the 2007 mortgage crisis, a DuPage bankruptcy judge sought copies of this graphic to help explain the process to people coming into his courtroom.
- Big search for something very small: This explaination of how the particle accelerator at FermiLab was being used to search for the graviton garnered some very positive reader feedback. And I got to vist FermiLab!
- Casino Addiction: How to compare a very large number of things to a very small number of things.
- Bionic arm: This small explainer was produced in about a day to make an embargo deadline.
- Chicago Fire stadium: We translated this graphic into Spanish for our sister publication Reflejos.
Design and illustration
From the Daily Herald.
- Premium section: At the Daily Herald, I was the go-to person for special projects, such as a premium-edition calendar.
- Special events: For the 100-year anniversary, I toured the Cantigny Museum and created this special page.
- Redesigns: Among the publications I've redesigned are the Daily Herald's Business Ledger, the Woodstock Independent and numerous other Daily Herald publications in southern and central Illinois.
- Cubs: Illustration for the National League Championship Series.
- Bulls v. Heat: Kick off for a playoff series.
- Champions: The front page for the 2010 Stanley Cup victory.
- Ready: A Bears/Green Bay showdown.
- Driving on Your Dime: Main illustration that became the logo for a series on taxpayer-funded cars.
- Wanted: A bit of fun with a story about the ash borer pest.
I also do this kind of stuff for fun:
-
I follow the current baseball season using the pybaseball library to extract stats, then create a site using the Python microsite creator Flask and the Seaborn charting library. Not updated during the current season as it's too painful to watch Chicago baseball in 2024.